Get Marketing Insights First
Subscribe to receive actionable strategies, growth tips, and industry insights delivered straight to your inbox.


Your 4.0 ROAS is a lie. Whilst your agency celebrates a successful month and your dashboard glows green, your net profit remains stagnant. You are a...
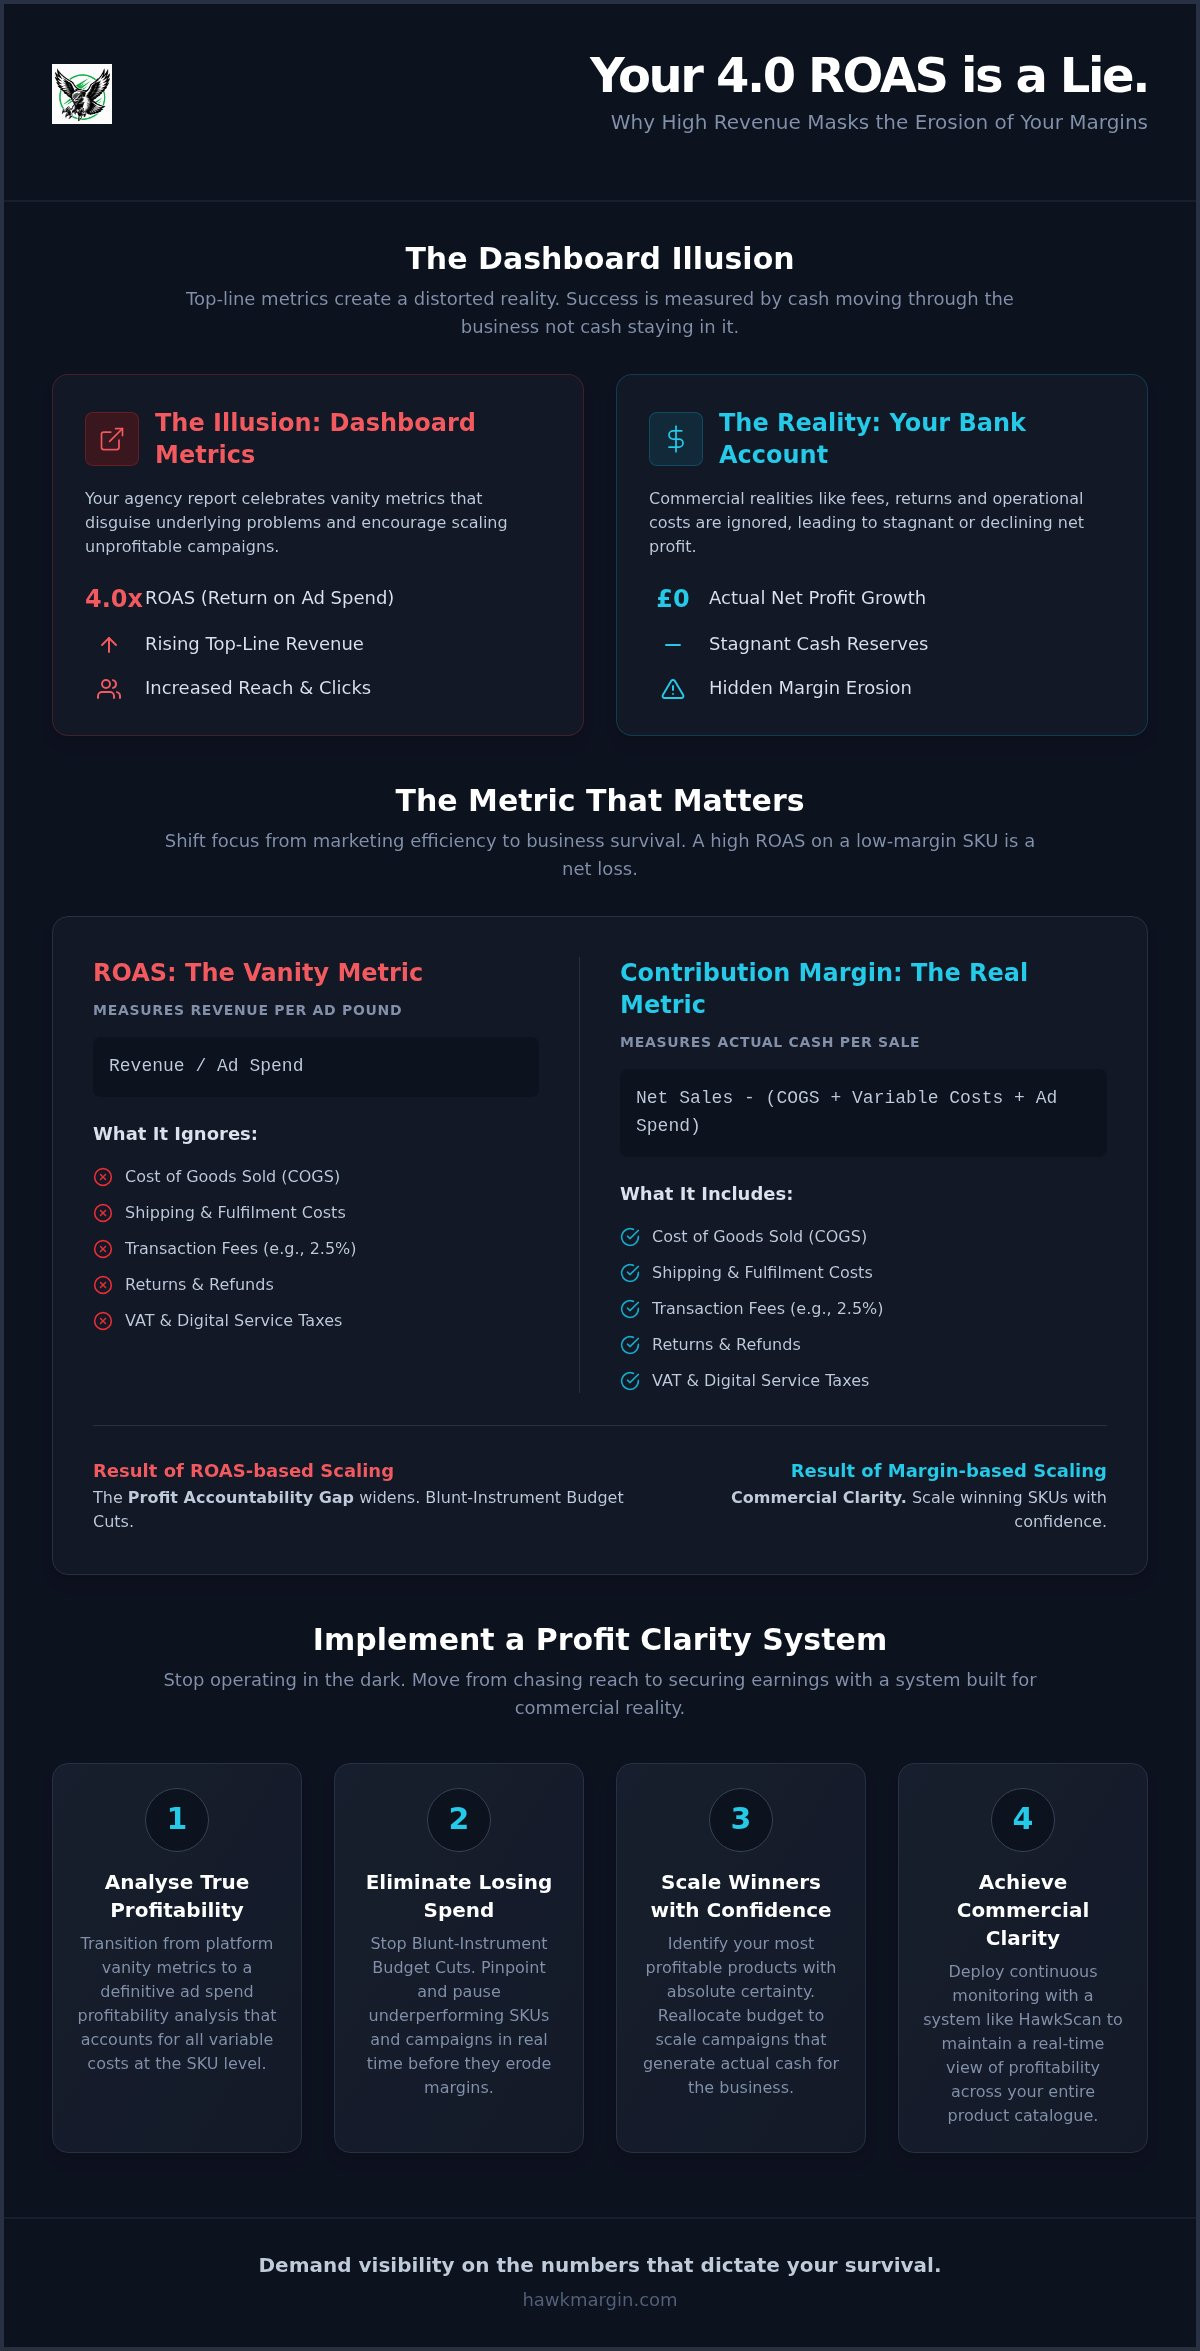
Your 4.0 ROAS is a lie. Whilst your agency celebrates a successful month and your dashboard glows green, your net profit remains stagnant. You are a victim of the Dashboard Illusion, where top-line revenue masks the erosion of your actual margins. Realising sustainable growth requires a move toward rigorous ad spend profitability analysis that accounts for every hidden cost, fee and commercial reality.
For high-growth brands like yours, currently revenue-rich but margin-blind, scaling spend without precision is a gamble that usually ends in Blunt-Instrument Budget Cuts. This guide moves beyond superficial metrics to reveal true SKU-level performance. We will show you how to close the Profit Accountability Gap and implement a Profit Clarity System that reflects the truth of your bottom line.
We are moving from chasing reach to securing earnings. You will learn how to identify losing products in real time and scale your winners with absolute confidence. It is time to stop operating in the dark and start demanding Commercial Clarity from every pound spent. We are dismantling the vanity metrics to focus on the only number that matters: the one in your bank account.
Standard dashboards are a hall of mirrors. They present a distorted reality where success is measured by the volume of cash moving through the business rather than the cash staying in it. This is the Dashboard Illusion. It convinces you that a 4.0 ROAS is a victory whilst your bank balance tells a different story. Without a rigorous ad spend profitability analysis, you are merely funding the growth of ad platforms at the expense of your own equity.
Scaling ad volume only accelerates the damage. As you increase spend, the Profit Accountability Gap widens. Small errors in margin calculation become systemic failures at scale. You might see £500,000 in monthly revenue and assume growth is healthy. In reality, rising Meta location fees and variable shipping costs could be turning every new customer into a net loss.
High revenue numbers are a sedative. They mask the steady erosion of your net profit percentage. Traditional ROAS is a blunt instrument because it ignores the commercial weight of your operations. Agencies often present reports that focus on click-through rates and platform-reported revenue. These reports are dangerous because they omit COGS and the digital services taxes now applied to UK ad spend.
Relying on revenue-based metrics creates a false sense of security. It leads to scaling losing campaigns because the platform says they are winning. True growth requires contribution margin analysis to ensure every SKU remains profitable after all variable costs are deducted. If you aren’t looking at the net margin after every transaction fee, you aren’t looking at the truth.
The Profit Accountability Gap is the distance between your marketing reports and your actual bank balance. It exists because platforms don’t see your returns, your VAT or your payment processing fees. In 2026, the complexity of advertising has increased with new location-based fees and stricter regulations on targeting. Managing a high-revenue brand with low visibility is a psychological drain that leads to reactive decision-making.
Strategic growth requires a shift from reach to commercial reality. You cannot scale what you cannot accurately measure at the SKU level. Establishing a definitive ad spend profitability analysis is the only way to stop the bleeding and start building a business that generates actual cash. Stop chasing vanity metrics and start demanding visibility on the numbers that dictate your survival.
Your ROAS is a vanity project. It is the foundation of the Dashboard Illusion. It measures revenue generated per £1 spent but ignores the commercial weight of your operations. A 5.0 ROAS on a low-margin SKU often leads to a net loss once you factor in the reality of your balance sheet. True ad spend profitability analysis requires looking past platform totals and into your actual contribution margin.
Contribution margin is the only metric that matters for scaling. It accounts for COGS, shipping and transaction fees. Whilst ROAS focuses on marketing efficiency, contribution margin focuses on business survival. If you scale based on ROAS alone, you are scaling a risk rather than a result.
To find your real performance, you must perform a rigorous ad spend profitability analysis by subtracting every variable cost from your net sales. The formula is binary: Net Sales minus COGS, shipping, payment fees and ad spend. This reveals the actual cash available to cover your overheads and contribute to net profit.
In the UK market, you must integrate the impact of returns and standard 2.5% payment gateway fees. These small percentages compound into a massive Profit Accountability Gap as your volume increases. Precision analysis must account for these fluctuations to maintain Commercial Clarity across your entire product range.
Most attribution models are designed to make ad platforms look successful. They inflate ROAS by claiming credit for organic sales whilst ignoring the bottom-line health of your brand. This is why founders see record revenue on Shopify whilst their cash reserves dwindle. The reporting tells you that you are winning whilst your bank account says otherwise.
There is a fundamental difference between marketing efficiency and business profitability. You can have an efficient ad account and a bankrupt company. It is vital to look beyond roas reporting to understand where your capital is actually going. You cannot afford to manage your business based on platform-level fiction.
Spreadsheets cannot keep up with this level of detail. By the time you update your manual logs, the data is already obsolete. You need a Profit Clarity System that monitors these shifts as they happen. Without it, you are just guessing with your own money and hoping for the best.
Closing the Profit Accountability Gap requires more than just a better spreadsheet. It demands a fundamental shift in how your business processes data. You must replace manual guesswork with a Profit Clarity System that monitors every SKU in real time. Scaling without this visibility is not growth; it is a slow-motion liquidation of your cash reserves.
Founders often wait until the end of the month to see if they made money. In 2026, that delay is fatal. You need to automate the data flow between Shopify and your advertising accounts to ensure your ad spend profitability analysis reflects the second-by-second reality of your margins. Precision is the only way to escape the Dashboard Illusion.
Stop relying on manual logs that cause decision lag. By the time your team updates a spreadsheet, your ad spend has already moved. You must connect your ad platforms directly to your net margin data. This ensures your marketing team and the leadership see the same commercial reality. Transparency eliminates friction and prevents the waste of precious capital on underperforming campaigns.
Every product in your catalogue must justify its place in your ad account. Many brands scale “hero” products that are actually burning cash due to high return rates or hidden shipping surcharges. Use a strategy on how to scale ads without losing money to identify winners with high margins but low current spend. These are your real growth engines. Cutting spend on unprofitable heroes is just as important as scaling your true winners.
Your ad spend profitability analysis is only as good as your inputs. Audit your COGS to include the 3% Meta location fees and the 2.5% transaction costs that traditional dashboards ignore. If your data is grounded in fiction, your scaling will be too. Accurate data is the antidote to the uncertainty that keeps most founders from scaling with confidence.
Finally, you must set hard profit floors for every campaign. Stop setting arbitrary ROAS targets that ignore the bottom line. A campaign must produce a minimum net margin after all costs are deducted. If a campaign drops below this floor, the spend is cut immediately. This discipline prevents you from scaling into a deficit and ensures every pound spent contributes to your actual bank balance.
Panic is the enemy of profit. When net earnings dip, the instinctive reaction is to slash spend across the board. These Blunt-Instrument Budget Cuts are a commercial failure. They don’t just trim the fat; they often sever the very arteries that keep your business alive. You need a surgical approach to ad spend profitability analysis to protect your profitable core.
True scaling is a function of margin confidence. It is not about whether you have the budget available. It is about knowing that every additional £1 spent will return more than it costs. Without this certainty, you are just gambling with higher stakes. Precision is the only way to navigate the rising costs of the UK advertising landscape.
Founders default to broad cuts because they lack visibility. They see a declining bank balance and assume the entire ad account is failing. This is a symptom of the Dashboard Illusion. You must distinguish between low-ROAS and low-profit campaigns. A high-revenue “hero” product might be losing money whilst a low-profile SKU is generating significant net margin. One is a liability; the other is an opportunity.
Maintaining Commercial Clarity during high-pressure periods like Black Friday is essential. Whilst competitors are blindly bidding up prices, you should be using precision analysis to identify which specific pounds are underperforming. Account for the 3% Meta location fees and payment processing costs before making a decision. You don’t need fewer ads; you need better ones. Trimming the fat requires knowing exactly where the fat is.
Scaling requires knowing exactly when a campaign crosses your profit floor. If you have to wait for a weekly agency report, you’ve already lost the opportunity. Real-time monitoring allows for aggressive growth because you aren’t afraid of invisible losses. You can push spend when the margin is there and pull back the moment it isn’t. This is the difference between a reckless gamble and a strategic investment.
You must monitor shopify advertising margins with total accuracy. This visibility transforms scaling from a stressful guessing game into a logical business progression. When you see the truth of your performance, you can outspend competitors who are still trapped in the Dashboard Illusion. Stop guessing and start scaling with precision. Deploy HawkScan to see your true margins today.
You have seen behind the curtain of the Dashboard Illusion. You know that your current reporting is likely masking a growing Profit Accountability Gap. Now you must decide if you will continue to operate in the dark. HawkScan is the definitive Ecommerce Profit Intelligence Platform designed to provide the continuous monitoring modern brands require.
Scaling a brand in the UK market requires more than just high-level revenue targets. It requires a Profit Clarity System that reflects the hard reality of your margins. By replacing fragmented data with a single source of truth, you can stop the bleeding and start scaling with absolute certainty. Precision is the only antidote to the rising costs of the digital marketplace.
HawkScan reveals the true margins that traditional dashboards intentionally miss. It performs a continuous ad spend profitability analysis that accounts for every variable cost, including the digital services taxes and location fees now impacting UK advertisers. This level of precision is impossible to achieve with manual spreadsheets or agency-provided PDFs that ignore the commercial weight of your operations.
Commercial Clarity is the difference between a scalable business and a high-revenue hobby. Founders who lack visibility on their net earnings are effectively operating a charity for ad platforms. You must take control of your margins. Stop being blind to the actual performance of your capital and start demanding accountability from every pound spent.
Implementing a rigorous ad spend profitability analysis is the only way to move from revenue-based scaling to profit-first growth. You now understand the steps required to close the gap and eliminate the need for Blunt-Instrument Budget Cuts. The data is available. The clarity is achievable. The only remaining variable is your willingness to confront the truth.
Revenue is vanity and profit is sanity. Every pound you commit to advertising must be a calculated move toward higher net earnings. Dismantle the illusion and start building your brand on the foundation of commercial reality. It is time to see the truth of your business and scale with the confidence that only profit visibility can provide.
The era of chasing vanity ROAS is over. You now have the framework to dismantle the Dashboard Illusion and close the Profit Accountability Gap. Shifting focus to contribution margin and SKU-level performance allows you to reclaim control over your scaling strategy. A rigorous ad spend profitability analysis is no longer optional; it is the baseline for survival in a high-stakes marketplace.
Stop trusting platform-reported revenue that ignores the commercial weight of returns, fees and location taxes. Replace reactive decision-making with a Profit Clarity System that prioritises net margin over top-line volume. You have the insights to scale with conviction rather than hope. It is time to stop guessing and start demanding precision from your data.
Take the next step toward total visibility. HawkScan provides continuous real-time monitoring that reveals true margins traditional dashboards miss. You can cancel at any time, but you won’t want to go back to operating in the dark. Get Commercial Clarity with HawkScan. Your business deserves the truth. Start scaling based on reality today.
ROAS is a superficial ratio that measures revenue against ad spend whilst ignoring the commercial weight of your operations. Profit-driven optimisation focuses on the net margin remaining after every variable cost is deducted. One chases vanity metrics that lead to the Dashboard Illusion; the other prioritises actual bank balance growth through rigorous ad spend profitability analysis.
You must subtract your COGS, shipping costs, payment gateway fees and ad spend from your net sales. This calculation reveals the actual pounds available to cover your fixed overheads. Traditional dashboards often ignore the 2.5% transaction fees and 3% Meta location fees now prevalent in the UK market. Precision requires accounting for every penny that leaves the business.
This discrepancy occurs because ROAS does not account for margin erosion or rising operational costs. You might be scaling “hero” products that have high return rates or hidden shipping surcharges. Whilst revenue increases, your net earnings are swallowed by the Profit Accountability Gap. High revenue without profit visibility is a commercial trap that leads to scaling losses rather than earnings.
No, Shopify reports lack the real-time integration with ad platforms required for a definitive ad spend profitability analysis. They cannot see your exact ad spend including digital services taxes or the fluctuating costs of customer acquisition. Relying on basic reporting leaves you margin-blind. You need a Profit Clarity System that connects your store data directly to your advertising accounts for a single source of truth.
Blunt-instrument budget cuts are panic-driven spending reductions applied across an entire account when profit dips. These cuts often damage your most profitable campaigns because you lack the visibility to distinguish them from losers. Avoid this by using precision analysis to identify exactly which campaigns have dropped below your profit floor. Cut the fat with a scalpel, not a sledgehammer.
Continuous monitoring is the only way to maintain Commercial Clarity in a fast-moving market. Monthly or even weekly audits are too slow to catch sudden margin erosion or rising acquisition costs. Real-time visibility ensures you can scale winners and kill losers the moment performance shifts. Waiting for a manual spreadsheet update is a luxury your cash flow cannot afford.
A complete audit requires accurate SKU-level COGS, blended shipping costs, payment gateway fees and platform-specific ad spend. You must also factor in return rates and any applicable digital services taxes for the UK. If any of these data points are missing or estimated, your profit reporting is a fiction. Grounding your audit in reality is the first step toward closing the Profit Accountability Gap.
Yes, HawkScan integrates with major advertising platforms and your Shopify store to provide an immediate view of your true margins. It replaces the Dashboard Illusion with a continuous stream of profit intelligence. By centralising your commercial data, HawkScan allows you to move from revenue-based guessing to profit-first scaling. Take control of your performance and see the truth of your business instantly.


