Get Marketing Insights First
Subscribe to receive actionable strategies, growth tips, and industry insights delivered straight to your inbox.


Your Shopify dashboard is a performance art piece designed to keep you spending. It celebrates top line growth whilst your margins are quietly eroded...
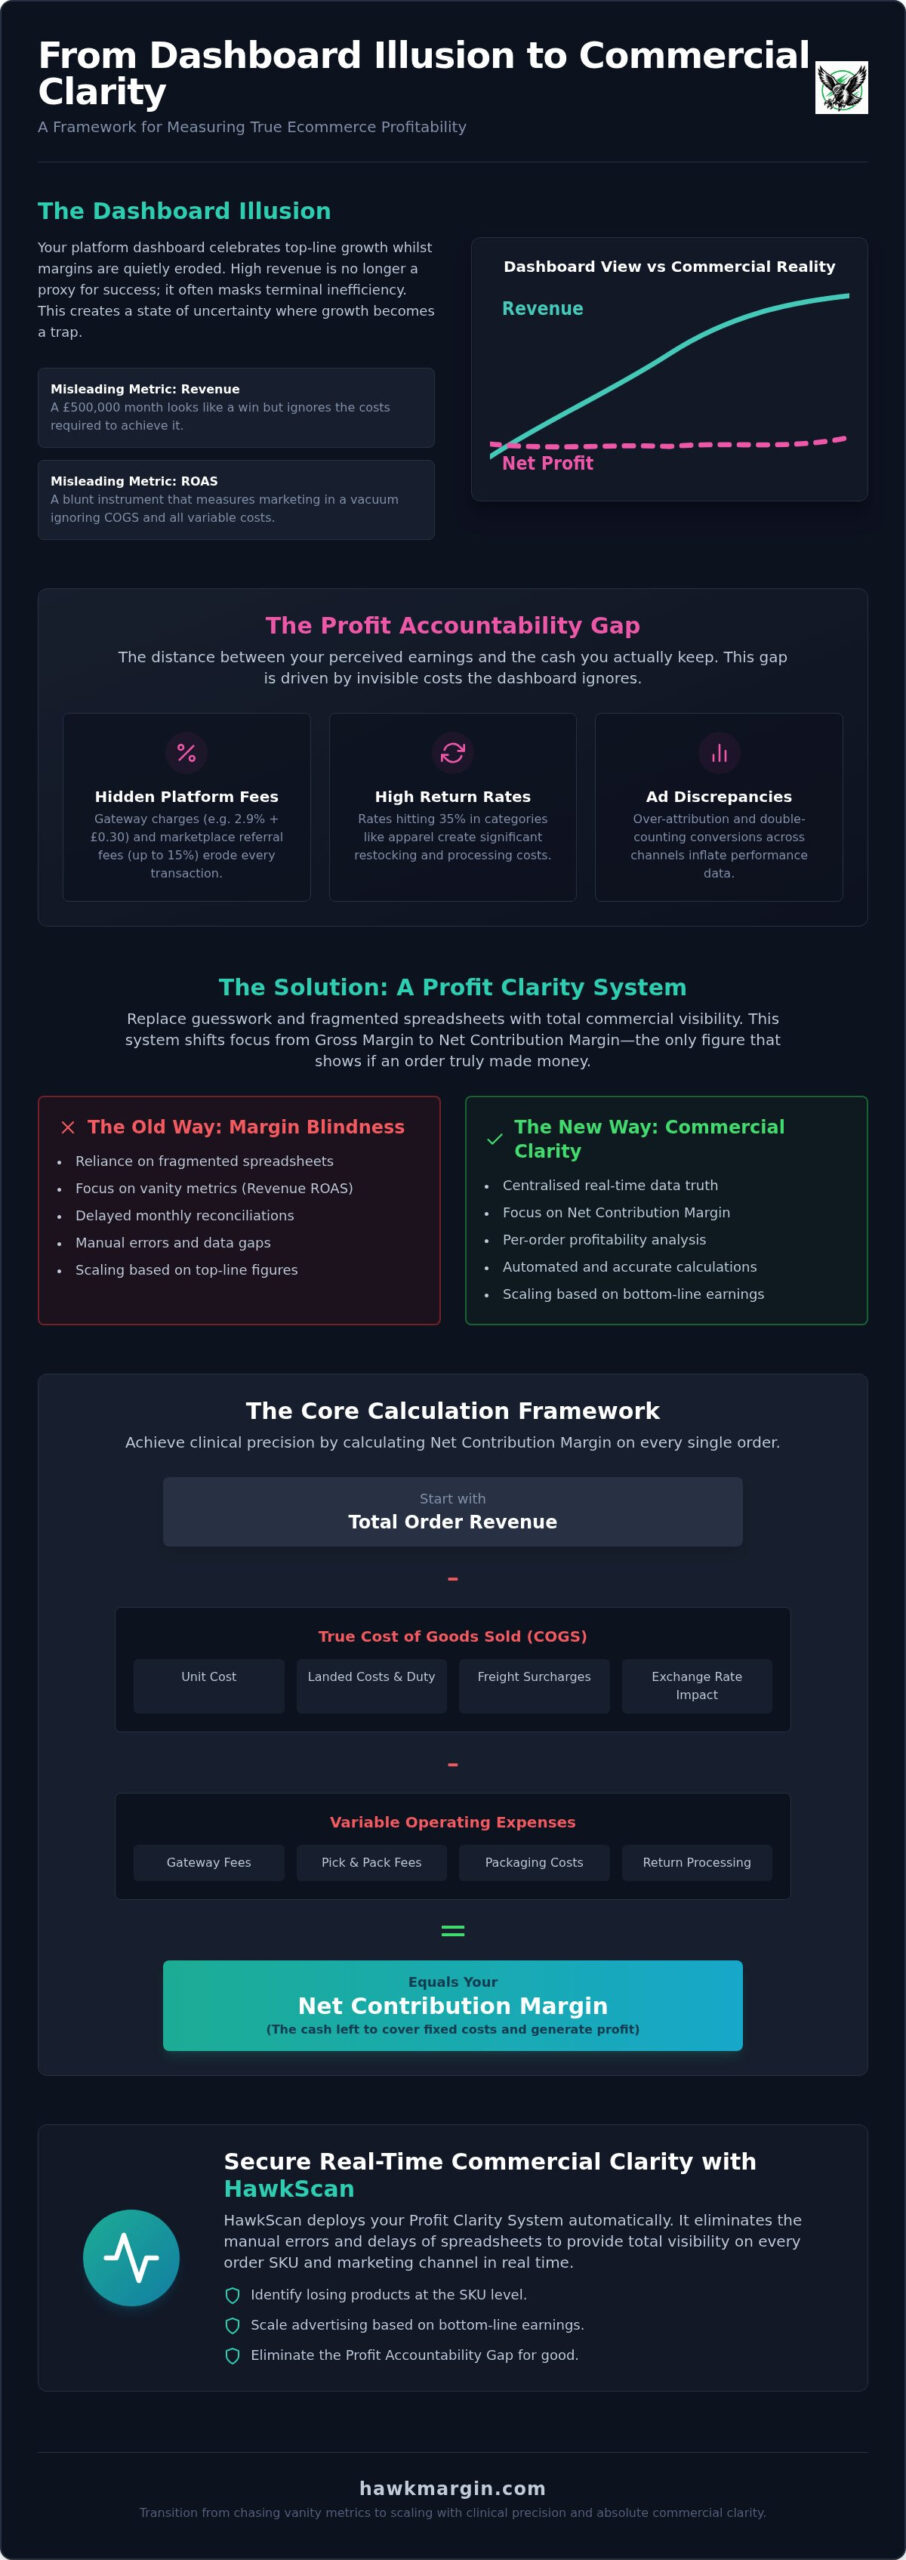
Your Shopify dashboard is a performance art piece designed to keep you spending. It celebrates top line growth whilst your margins are quietly eroded by invisible costs and shifting tax regulations. You are likely scaling ad spend based on a ROAS figure that bears no resemblance to the actual cash left in your business. This is the Dashboard Illusion. It creates a state of uncertainty where revenue growth becomes a trap rather than a victory.
You recognise the frustration of watching revenue climb whilst your net margin retreats. You aren’t alone in facing the Profit Accountability Gap. This guide details how to measure ecommerce profitability by establishing a Profit Clarity System that reveals your true commercial margins in real time. We will strip away the marketing fluff to provide total visibility on every order. You are about to transition from chasing vanity metrics to scaling your brand with clinical precision and absolute commercial clarity.
Most founders mistake activity for achievement. You see a £500,000 revenue month and celebrate a win. Your bank balance tells a different story. This is the Dashboard Illusion. It is the psychological safety net of a green Shopify graph that masks a bleeding bottom line. In the 2026 market, high-volume revenue is no longer a proxy for success. It is often a mask for terminal inefficiency.
The market has shifted. Meta and Google CPMs rose by 12% to 18% over the last year. Carrier rates from major providers like UPS and FedEx implemented an average increase of 5.9%. If you are relying on Shopify native reports, you are operating with a massive blind spot. These dashboards show you sales; they do not show you net margin. Scaling ad spend based on top-line revenue alone is not growth. It is a trap that leads directly to the Profit Accountability Gap.
ROAS is a blunt instrument. It measures marketing efficiency in a vacuum. It ignores your Cost of Goods Sold and variable operating costs. When you ask why is ROAS high but profit low, the answer is found in the costs the dashboard ignores. Platform attribution is notoriously optimistic. It overstates campaign impact to justify more spend. You cannot pay your staff or your suppliers with a ROAS figure. You need to understand how to measure ecommerce profitability by looking at the cash remaining after every variable cost is deducted.
The Profit Accountability Gap is the distance between your perceived earnings and the cash you actually keep. Three drivers dominate this gap. First, hidden fees like the 2.9% plus £0.30 Shopify processing charge or common 15% Amazon referral fees. Second, return rates that hit 35% in categories like apparel. Third, ad platform discrepancies that double-count conversions across channels. Many brands attempt to offset these losses by focusing on customer lifetime value; however, future potential does not solve a current liquidity crisis. Manual spreadsheets are too slow and prone to error to catch these leaks in real time. You need a Profit Clarity System that monitors these variables as they happen.
Fragmented spreadsheets are where profit goes to die. Relying on disconnected data sources is a choice to remain blind. To fix this, you must implement a Profit Clarity System. This is a rigorous framework that replaces guesswork with total commercial visibility. It moves your focus from gross margin to net contribution margin. This is the only figure that tells you if an order actually made money.
British brands face a distinct set of complexities. You must account for VAT obligations and the rising cost of domestic and international shipping. Ignoring these variables is a dangerous oversight. Establishing a centralised data truth is the only way to achieve commercial clarity in a volatile market. It ensures you are no longer operating in a state of uncertainty.
Your unit cost is only the beginning. A professional COGS calculation must include landed costs and duty. Freight surcharges and post-Brexit customs fees are not optional extras; they are fundamental to your margin. You must also account for fluctuating exchange rates. A sudden shift in the value of the British Pound against the US Dollar can instantly turn a profitable SKU into a liability. Understanding these nuances is essential for scaling ecommerce profit not revenue.
Real-time visibility requires accounting for every penny that leaves your account the moment a customer clicks buy. This includes gateway transaction costs like the 2.9% plus £0.30 fee standard on many platforms. You must also factor in pick and pack fees and the cost of packaging. The most overlooked variable is the return tax. With apparel return rates hitting 35%, the cost of processing and restocking is a significant margin killer. You cannot wait until the end of the month to see these leaks. Accurately measuring ecommerce performance requires these costs to be calculated at the point of sale. This is the foundation of how to measure ecommerce profitability with clinical precision. If you are still relying on monthly reconciliations, you are already behind.
ROAS is a platform-reported vanity metric. It keeps your marketing agency happy whilst your bank balance remains stagnant. If you want to know how to measure ecommerce profitability, you must shift your focus to Contribution Margin. This is the profit remaining after every variable cost and every pound of ad spend is cleared. It is the only metric that allows for safe and aggressive scaling.
Contribution Margin provides a binary framework for decision-making. Platform ROAS says you are winning; Contribution Margin tells you if you can afford to keep the lights on. Scaling ad spend without this visibility is a gamble. You must identify the point of diminishing net returns. This is the threshold where increasing your budget actually reduces your total net profit. Without this insight, you are simply buying revenue at a loss.
The formula for marketing contribution is direct: Gross Profit minus Total Marketing Spend. You cannot look at channels in isolation. You need a blended view that accounts for spend across Meta, Google and TikTok simultaneously. Fragmented reporting leads to Blunt-Instrument Budget Cuts. This is a reactive move where founders slash spend across the board because they feel a squeeze. Without commercial clarity, you risk killing the very campaigns that sustain your actual margin.
Standard pixel data is no longer sufficient for high-growth brands. 2026 attribution requires a definitive connection between ad spend and order-level profitability. You need to see the net impact of every campaign as it happens. This is why HawkScan is essential. It identifies which specific ad sets are driving net earnings rather than just inflated traffic numbers. It provides the ecommerce key performance indicators that actually dictate your commercial survival. When you connect spend directly to profit, you stop guessing and start dominating your market. This transition from platform metrics to real-time earnings is the hallmark of a mature ecommerce operation.
Store-wide averages are a hiding place for failure. You might see a healthy net margin across the business whilst individual products are actively draining your cash reserves. This is a primary driver of the Profit Accountability Gap. High-growth brands must move beyond aggregate data to perform rigorous SKU-level analysis. If you don’t know the net margin of every item you sell, you don’t truly know your business.
True commercial clarity requires looking at the specific unit economics of every item in your catalogue. A product with a 4.0 ROAS looks like a winner on Meta. However, if that product has a high return rate or excessive shipping weight, it may be a net loss. You are essentially paying for the privilege of shipping items that will eventually be returned at your expense. This is why learning how to measure ecommerce profitability at the SKU level is a non-negotiable requirement for survival in a competitive market.
You must identify products with high top-line performance but low contribution. Some of your best sellers are likely your biggest financial risks. Analyse the cost of customer acquisition against the actual margin of the SKU. If the variable costs, including pick and pack fees and return processing, exceed the gross profit, that SKU is a liability. You cannot scale a brand on products that lose money with every transaction. Stop chasing volume on items that compromise your liquidity.
Consider the impact of shipping weight and return frequency on specific product margins. In the UK, carrier surcharges for bulky items can fluctuate, instantly erasing the thin margins of low-value SKUs. If an item has a 25% return rate, you aren’t just losing the sale; you are paying for the outbound shipping, the return shipping and the labour to restock. These hidden leaks are often invisible in Shopify reports but become glaringly obvious when you apply a Profit Clarity System.
Once you have the data, you must act with clinical precision. Shift your ad budget away from volume-drivers that erode margin and toward high-margin SKUs with stable return rates. You may need to adjust pricing strategies or discontinue certain lines entirely. This is not about blunt-instrument budget cuts; it is about strategic reallocation of capital to the areas of your business that actually generate wealth. Use HawkScan to secure commercial clarity and focus exclusively on the winners that drive net earnings.
Manual spreadsheets are a commercial liability. They are static, prone to human error and perpetually out of date. If your brand is spending £50,000 or more every month on advertising, relying on a weekly manual audit is a choice to lose money. You cannot navigate a high-speed market with a rear-view mirror. You need a system that operates at the pace of your transactions.
HawkScan is the antidote to the Profit Accountability Gap. It replaces fragmented data with automated intelligence that monitors your store and ad accounts in real time. This platform reveals the true margins hidden by platform-reported ROAS. It provides the only definitive answer to how to measure ecommerce profitability whilst maintaining the speed required for aggressive scaling.
A manual check is a post-mortem. It tells you that you lost money last week when the damage is already done. HawkScan provides continuous monitoring of every product listing and ad set to identify margin drops the moment they occur. This allows you to kill losing campaigns before they erode your monthly net profit. It exposes the Dashboard Illusion by connecting every pound spent directly to the cash remaining in your bank account.
The goal of a business is not to generate high-volume revenue; it is to generate sustainable earnings. Scaling ad volume without profit visibility is simply buying growth with your own margin. HawkScan allows you to shift your internal focus to bottom-line health. You gain the ability to make decisive commercial moves based on real-time data rather than platform-driven hype. This is the transition from being margin-blind to possessing total Commercial Clarity.
Becoming a profit-first leader requires a fundamental shift in how to measure ecommerce profitability. You must value accuracy over vanity and earnings over reach. With HawkScan, you stop guessing which channels work and start seeing exactly where your wealth is created. You secure a superior vantage point that allows you to see through the clutter that confuses your competitors. This is how you build a brand that is not just large but commercially dominant.
Revenue without visibility is a ticking clock. You’ve seen how the Dashboard Illusion masks the reality of your bank balance and how the Profit Accountability Gap erodes your hard-earned growth. Mastering how to measure ecommerce profitability isn’t just an accounting exercise; it’s a strategic necessity for those who intend to lead their market in 2026 and beyond.
By implementing a Profit Clarity System and focusing on SKU-level contribution margins, you move from reactive survival to proactive dominance. You stop being a passenger to platform algorithms and start making clinical, data-driven decisions that prioritise net earnings over vanity reach. The transition from margin-blindness to total Commercial Clarity is the final hurdle in your journey toward a truly scalable enterprise.
Stop guessing and start scaling with HawkScan. You gain real-time profit insights and continuous store monitoring with no long-term contracts to hold you back. The truth of your business performance is waiting. It’s time to take control and build the profitable legacy your brand deserves.
Gross profit is a basic calculation that only deducts the Cost of Goods Sold from your total revenue. Contribution margin is a far more rigorous metric that subtracts all variable costs including marketing spend, shipping fees and payment gateway charges. It is the only figure that reveals the true cash impact of every order after all operational friction is cleared.
ROAS is a dangerous vanity metric because it ignores the cost of the product and your variable overheads. A 5.0 ROAS on a low-margin SKU can result in a net loss whilst a 2.5 ROAS on a high-margin item might be highly profitable. You cannot bank a percentage; you can only bank the net margin that remains after the platform has taken its cut.
Real-time visibility is the only standard that matters for brands spending over £50,000 per month. Monthly reconciliations are merely post-mortems that arrive too late to influence your current scaling decisions. You need to know how to measure ecommerce profitability as transactions occur to prevent the Dashboard Illusion from masking a liquidity crisis.
Manual spreadsheets are a commercial liability for high-volume brands. The complexity of fluctuating shipping rates, exchange values and multi-channel ad spend makes manual auditing prone to catastrophic human error. You cannot achieve total Commercial Clarity through static documents that are out of date the moment you hit save.
Hidden costs include payment gateway fees of 2.9% plus £0.30 and carrier rate increases which averaged 5.9% in 2026. Pick and pack surcharges and VAT discrepancies also erode your bottom line silently. These variables create a Profit Accountability Gap that traditional dashboards fail to identify until your margins have already disappeared.
Returns act as a direct tax on your margin that must be accounted for at the point of sale. With apparel return rates hitting 35%, you must factor in the cost of outbound shipping and restocking labour immediately. Real-time systems prevent you from over-scaling ad spend based on revenue that will eventually be refunded.
DTC brands on Shopify typically target net margins between 10% and 20% to remain healthy. If your margin falls below this range, you are likely suffering from invisible cost leaks or inefficient ad spend. Maintaining this level of performance requires a Profit Clarity System that monitors every SKU with clinical precision.
Shopify analytics focus on top-line revenue and basic order volume. HawkScan provides continuous monitoring of your actual net profit by integrating landed costs and real-time ad spend from every platform. It replaces the Dashboard Illusion with a definitive view of your commercial reality and identifies exactly where your wealth is created.