Get Marketing Insights First
Subscribe to receive actionable strategies, growth tips, and industry insights delivered straight to your inbox.


Your 4.0 ROAS is a fiction. Whilst your Shopify dashboard celebrates record revenue, your bank balance remains stubbornly stagnant. This is the...
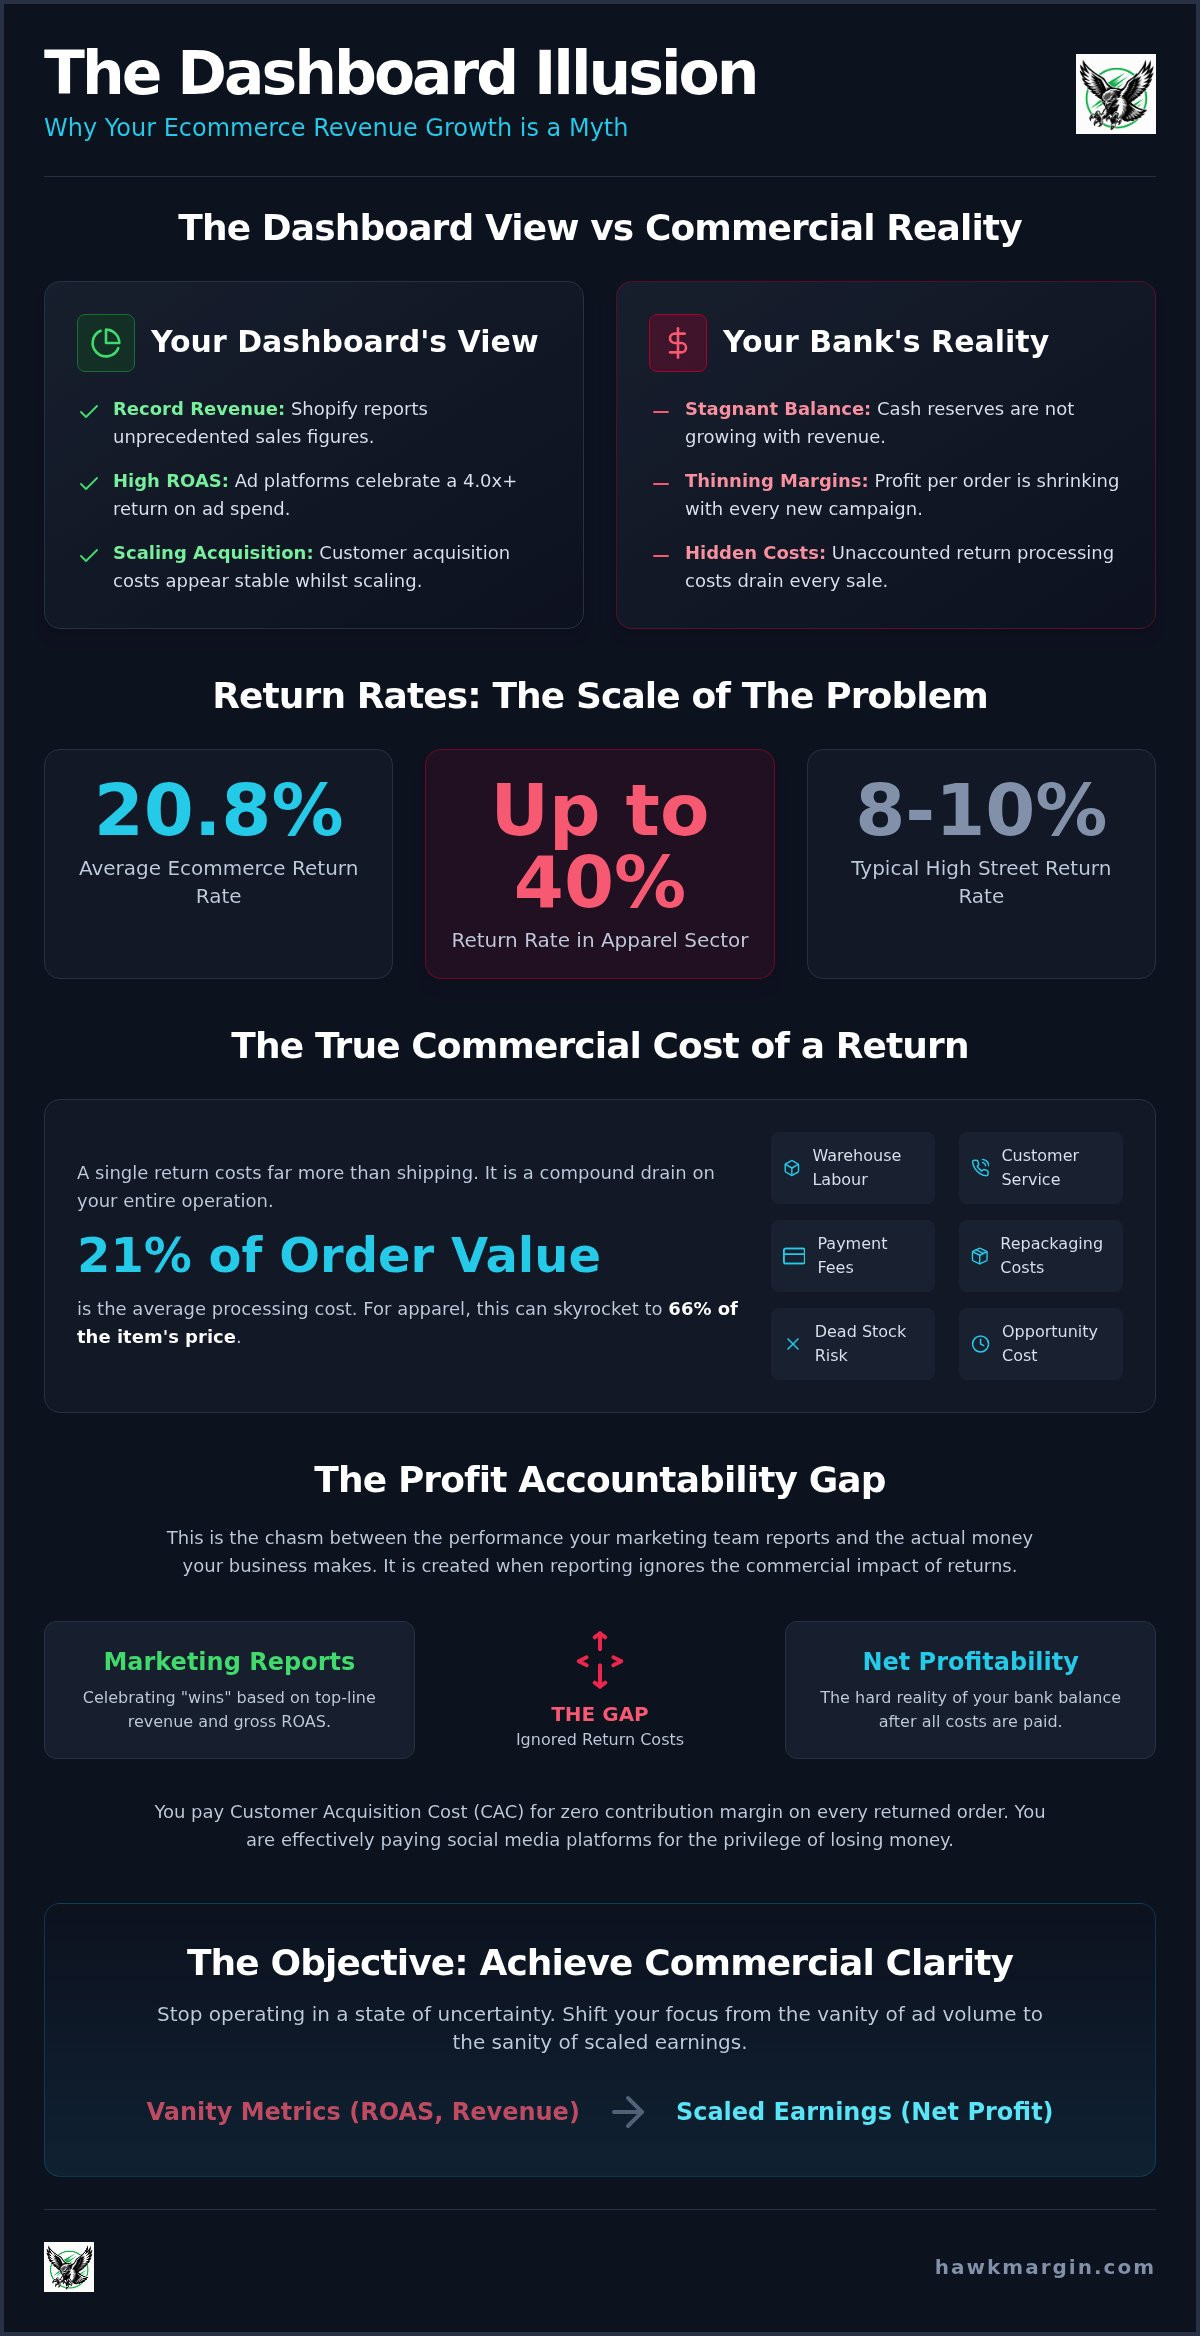
Your 4.0 ROAS is a fiction. Whilst your Shopify dashboard celebrates record revenue, your bank balance remains stubbornly stagnant. This is the Dashboard Illusion in full effect. You are likely ignoring the ecommerce return rate impact on profitability which currently drains an average of 21% of order value in processing costs alone. For apparel founders, the cost of a single return can reach 66% of the item’s price.
You recognise the frustration of scaling ad spend only to find margins thinning with every new customer. It is a structural defect in your data that creates a widening Profit Accountability Gap. This guide moves beyond top-line vanity metrics to protect your actual bottom line. We will expose the hidden costs that standard reporting misses and provide a framework for genuine Commercial Clarity.
We will examine a clinical breakdown of return costs by category and establish a system to identify which products are liabilities. The objective is to shift your focus from ad volume to scaled earnings. You will stop operating in a state of uncertainty and start seeing the hard reality of your business performance.
Revenue is a vanity metric. Profit is sanity. For many founders, the gap between the two is filled with returned parcels. The ecommerce return rate impact on profitability is not just a line item in your shipping bill; it is a structural drain on your entire operation. It corrupts your data and forces you into a cycle of aggressive scaling that actually reduces your net worth.
Whilst a brick-and-mortar store might see return rates of 8% or 10%, the ecommerce reality is far more aggressive. Industry data shows average online return rates sitting at 20.8%. In sectors like apparel, this figure often surges to 40%. Understanding the ecommerce return rate impact on profitability is the only way to escape the trap of profitless growth and ensure your business remains sustainable.
Your Shopify dashboard shows a green arrow. Your Meta Ads Manager reports a 5.0 ROAS. This is the Dashboard Illusion. It treats a sale as a final event, but for many, it is merely the start of a costly product return process. When your reporting ignores the high probability of a reversal, your view of customer acquisition success is fundamentally distorted.
If 30% of your orders are destined to come back, your reported CAC is a lie. You are making strategic decisions based on revenue that does not belong to you. This creates a Profit Accountability Gap where marketing teams celebrate “wins” that actually erode your bank balance. You cannot scale a business on “maybe” money.
Traditional retail accounting was never designed for the volatility of digital trade. High street shoppers touch, feel and try on products before the transaction. Online, the bedroom has become the fitting room. This psychological shift has driven the rise of “bracketing”, where customers buy multiple sizes or colours with the explicit intention of returning the majority of the order.
The UK market faces unique pressures here, particularly in apparel and electronics. Free returns have moved from a perk to a baseline expectation, yet the cost of this “service” is rarely baked into the product margin. You aren’t just losing the sale; you are paying for the labour, shipping and repackaging required to put that item back on the shelf. This is the reality that standard dashboards hide and what founders must eventually confront to survive.
Most founders calculate return costs by looking at their monthly courier bill. This is a dangerous oversimplification. The ecommerce return rate impact on profitability extends far beyond the shipping label. It is a compound drain involving reverse logistics, repackaging and the immediate loss of non-refundable payment processing fees.
Research indicates that processing a single online return costs an average of 21% of the total order value. In high-stakes categories like apparel, this cost can skyrocket to 66% of the item’s original price. Achieving Commercial Clarity requires you to look at the total destruction of value, not just the outbound logistics. You are losing money on the transaction, the labour and the potential for a future sale.
Every returned parcel demands human intervention. You are paying for warehouse labour to receive, inspect and grade the item. You are paying for customer service teams to manage the “Where is my refund?” tickets. These staff hours are often buried in general overheads, masking the true ecommerce return rate impact on profitability.
Then there is the issue of “dead stock”. Industry data shows that only 43.7% of returned products are resold at full price. Over 30% of returned items cannot be resold as new at all. Whilst that inventory sits in a transit loop or a grading bay, it isn’t on your digital shelf. You are losing the opportunity to sell that stock to a customer who would actually keep it, creating a massive opportunity cost in your warehouse.
Your marketing agency likely reports on gross ROAS. They take credit for the sale but ignore the return. If your customer acquisition cost (CAC) is £30 and the order is returned, you haven’t just lost the margin. You have effectively made a £30 donation to a social media platform for zero commercial return. You are paying for the privilege of losing money.
Standard attribution models are part of the Dashboard Illusion. They fail to calculate a return-adjusted CAC, leading you to pump budget into campaigns that are structurally insolvent. To stop this leak, you need a profit intelligence platform that reconciles ad spend against net margin in real-time. Without this visibility, you are scaling a hole in your pocket. Every “win” at the top of the funnel becomes a guaranteed loss at the bottom.
Standard ecommerce reporting is built on a lie. It prioritises the moment of transaction whilst ignoring the inevitable reversal. This creates a Profit Accountability Gap where your marketing team claims victory for sales that will eventually be wiped from your books. You are essentially operating with a delayed mirror; by the time you see the reflection, the damage is already done.
The ecommerce return rate impact on profitability is often hidden by the time lag between the “win” of the sale and the “loss” of the return. A customer might buy on a Monday, but the return often doesn’t hit your system for 14 to 21 days. If you are making daily budget decisions based on gross revenue, you are scaling a ghost. You need to focus on scaling ecommerce profit not revenue to ensure your growth is actually contributing to your net worth.
Real-time ROAS is the ultimate Dashboard Illusion. It provides a dopamine hit of 4x or 5x returns that simply does not exist in reality. If your brand experiences a 30% return rate, that 4x ROAS is functionally a 1x ROAS once you account for the ecommerce return rate impact on profitability and operational overheads. You are celebrating break-even performance as if it were a massive success.
Scaling ad spend based on unadjusted data is a recipe for a liquidity crisis. Founders often wonder why their bank balance doesn’t match their Shopify reports. The answer is simple. Your dashboard is reporting on a “maybe” whilst your suppliers and ad platforms are demanding a “definitely”. You cannot pay your staff with revenue that is currently sitting in a cardboard box on a courier van.
Manual profit tracking is too slow for a modern ecommerce store. By the time your finance team reconciles the previous month’s returns, you have already spent another £50,000 on failing campaigns. This delay forces founders into making Blunt-Instrument Budget Cuts. When you see profit dipping but don’t know why, the natural reaction is to slash spend across the board.
This knee-jerk reaction often kills your best-performing products alongside your liabilities. You lose Commercial Clarity and begin operating out of fear rather than data. Static spreadsheets are a post-mortem tool; they tell you how you died but do nothing to keep you alive. Continuous profit intelligence is the only way to identify high-return SKUs in real-time and stop the bleed before it becomes terminal.
Growth at any cost is a trap. You must audit the ecommerce return rate impact on profitability at the granular level to distinguish between healthy scaling and structural decay. Most founders fear that tightening return policies will kill their conversion rate. They ignore the fact that high-volume sales of high-return items are mathematically destined to fail.
Your catalogue is likely hiding products that are structurally incapable of generating profit. Use SKU-level data to find items where sizing issues or inaccurate descriptions drive a 40% return rate. These are the structural defects causing your Profit Accountability Gap. You must master the process of identifying low margin products to prune your catalogue of these liabilities.
Audience segmentation is equally critical. Serial returners represent a tiny fraction of your database but a massive portion of your operational costs. Research shows 63% of consumers admit to “bracketing” by buying multiple sizes with the intent to return. If a customer’s net contribution margin remains negative after multiple orders, you must stop paying to re-acquire them. Pruning these segments protects your bottom line whilst allowing you to focus on high-value buyers who actually keep what they buy.
Free returns are a choice, not a law. Whilst 82% of consumers claim free returns influence their shopping behaviour, 65.2% of merchants now charge a fee for mail-in returns to offset rising costs. You must weigh the conversion lift against the logistical drain. Moving to a paid return model for specific categories or offering store credit incentives can immediately reclaim lost margin without alienating your core audience.
Data allows you to justify these policy changes with clinical precision. If a specific product category has a return rate double the store average, it is time to charge for returns on those items or stop advertising them entirely. Stop operating under the Dashboard Illusion and start making decisions based on net margin reality. You can protect your profitability now by implementing a system that tracks the true cost of every return in real-time.
Accepting the status quo is a choice. You can continue to scale based on the Dashboard Illusion or you can choose to see the hard reality of your performance. HawkScan is the antidote to the misleading metrics that plague the ecommerce industry. It provides the superior vantage point required to see through the clutter of gross revenue and unadjusted ROAS.
Whilst standard Shopify reports hide the truth; HawkScan reveals the ecommerce return rate impact on profitability with clinical precision. It is not a passive reporting tool. It is a Profit Clarity System designed for high-stakes decision makers who value data driven truth over superficial growth. You stop chasing revenue that eventually disappears and start protecting the margins that actually build wealth.
Manual reconciliation is a relic of the past. HawkScan monitors your stores and ad accounts continuously; integrating fragmented data into a single source of truth. It accounts for returns as they happen rather than weeks after the damage is done. This real-time visibility ensures that you are never blindsided by a collapsing net margin during an aggressive scaling phase.
This level of precision eliminates the Profit Accountability Gap. You no longer have to guess which campaigns are structurally insolvent due to high return rates. The platform replaces the vague promises of marketing agencies with definitive net profit data. You gain the ability to spot a liability before it drains your cash reserves; allowing for surgical adjustments rather than Blunt-Instrument Budget Cuts.
High return rates are not a fixed cost of doing business. They are a variable that can be managed once they are visible. Founders who possess Commercial Clarity have a decisive competitive advantage. They know their true numbers whilst their rivals are still celebrating the Dashboard Illusion. This allows for aggressive scaling where others are forced to retreat.
Reclaiming your visibility is the first step toward transforming your internal business conversations. You move from discussing “reach” to discussing “retained earnings”. The state of uncertainty you are currently operating in is a choice that only specific expertise can resolve. To ensure every pound of ad spend is contributing to your bottom line; you must implement a rigorous ad spend margin analysis. The era of margin-blind growth is over.
The ecommerce return rate impact on profitability is a structural reality that most founders ignore until it is too late. You cannot scale a business on gross revenue whilst your net margin is being eroded by reverse logistics and marketing waste. It is time to close the Profit Accountability Gap and stop making decisions based on the Dashboard Illusion of unadjusted ROAS.
Genuine growth requires a Profit Clarity System that reconciles every return against your ad spend in real-time. By moving beyond static spreadsheets and identifying high-risk SKUs; you gain the ability to make surgical adjustments instead of Blunt-Instrument Budget Cuts. You are no longer operating in the dark; you are leading with precision.
HawkScan offers continuous monitoring of your store and ad accounts to provide real-time profit insights that expose your true margins. With a no-lock-in subscription for total transparency; you can finally see the hard reality of your business performance. Discover the true margin of your store with HawkScan and start scaling earnings rather than just volume. You have the tools to turn data into a definitive competitive advantage.
A high return rate creates a structural drain on your bottom line by reversing the margin on a sale whilst leaving the operational costs intact. The ecommerce return rate impact on profitability includes non-refundable payment processing fees and the loss of the original customer acquisition cost. When 20% or more of your orders come back; your net margin collapses even if your gross revenue continues to grow. You are essentially paying for the privilege of losing money.
Typical return rates vary by sector but the 2026 industry average for online retail sits at approximately 20.8%. In the UK apparel market; these figures frequently reach 30% to 40% due to “bracketing” behaviour amongst consumers. Whilst electronics might see lower rates of 8% to 10%; the overall ecommerce reality is significantly higher than the 8.72% seen in traditional brick and mortar stores. You must benchmark against your specific category to find the truth.
Gross revenue represents the Dashboard Illusion because it measures the intent to buy rather than the final transaction. It fails to account for the high probability of a reversal; leading founders to scale based on money that will eventually leave their bank account. Relying on gross figures creates a Profit Accountability Gap where marketing teams claim success for orders that actually result in a net loss. True Commercial Clarity requires a focus on retained earnings instead.
You must subtract the original COGS; outbound shipping; reverse logistics costs; non-refundable transaction fees and warehouse labour from the original sale price. If the item cannot be resold at full price; you must also factor in the stock depreciation. Calculating the ecommerce return rate impact on profitability requires a clinical view of every touchpoint in the product return process to find the true net contribution. Most founders ignore these hidden variables until their margins vanish.
You can reduce returns by improving product description accuracy and using SKU-level data to identify structural defects in your catalogue. Sizing and fit issues cause 45% of all returns. Providing precise measurements or high-definition video can lower the return rate without deterring buyers. This data-driven approach allows you to maintain conversion whilst eliminating the low-margin orders that drain your resources. It is about attracting the right buyer; not just any buyer.
Hidden costs include the staff hours spent on inspection and grading; customer service time spent on refund queries and the cost of “dead stock” sitting in transit. Only 43.7% of returned items are typically resold at full price. You also lose the opportunity cost of warehouse space and the non-refundable ad spend used to acquire a customer who did not keep the product. These micro-losses aggregate into a massive structural drain on your annual profit.
HawkScan provides continuous monitoring of your store and ad accounts to reconcile returns against your net margin in real-time. It moves beyond the Dashboard Illusion by automatically adjusting your profit data as returns are processed. This Profit Clarity System ensures that your scaling decisions are based on retained earnings rather than gross revenue; allowing for surgical budget allocation instead of Blunt-Instrument Budget Cuts. You see the hard reality of your performance as it happens.
Standard reports are often static and fail to integrate real-time ad spend or operational overheads like warehouse labour. They create a lag between the sale and the return; masking the true commercial reality of your performance. Without a platform like HawkScan; you lose visibility on the Profit Accountability Gap; leaving you unable to see which products are actually eroding your total business profitability. You end up celebrating top-line growth whilst your actual bank balance remains stagnant.